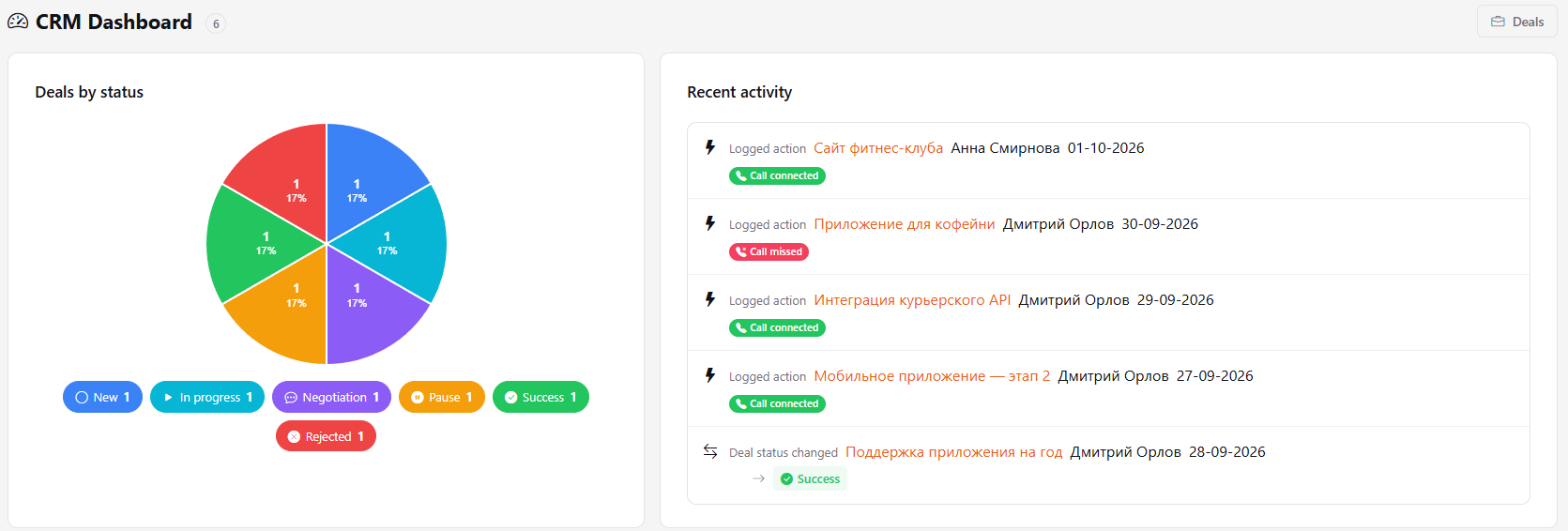
The Marketing dashboard is a one-screen sales summary: how many deals are at each stage of the funnel and what the team has been doing with deals lately.
Where to find
Sidebar → Marketing. The number next to the Marketing Dashboard title is the total number of deals in the organization. The Deals button on the right opens the deal funnel.
Stale deals
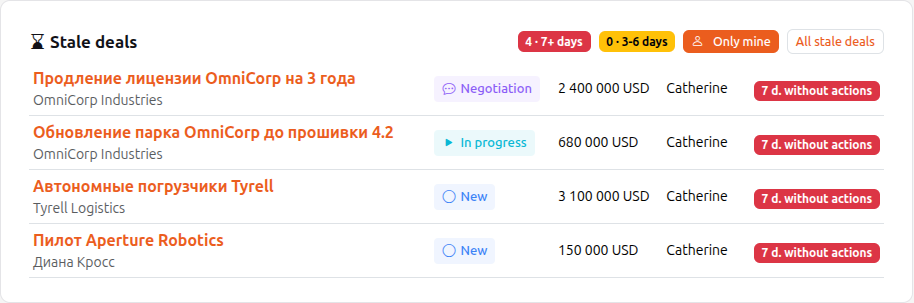
Above the chart is a list of open deals (New, In progress, Negotiation) with no recent activity: no edits, comments or history entries. The oldest are on top, each shows how many days it has been idle. A red badge means 7+ days, a yellow one 3-6 days; the badges show how many deals are in each group. Only mine keeps the deals where you are the manager, All stale deals opens the deals board with this filter. The same deals reach the manager in the Auto Summary as a Stale deals block.
Reports
Managers and above see a Reports block above the recent activity, with tabs: By status, Funnel, Response speed, Load, Losses, Top clients. The By status tab is the pie chart from the section below, but it follows the filters.
The filters are shared by all tabs: the period (the Month, Quarter, Year, All time buttons or your own dates; the last 90 days by default), Funnel and Manager. The Export to Excel button saves all six reports in one file, a sheet per report, with the same filters.
- Funnel. Of the deals created in the period, how many reached each stage and the conversion from the previous stage. The main path (New, In progress, Negotiation, Success) is cumulative: a deal that reached a later stage is counted on the earlier ones too. Pause and Rejected are shown as a percentage of the created ones. For old deals without a transition history only the current status is counted, so the figures for them are approximate.
- Response speed. How long it takes until an employee first reacts to a deal or lead (working hours from Deals → Deal SLA): the average, the median, by manager, the share within the SLA norm, and how many requests are left without a reaction. Deals and leads are counted separately. The funnel filter does not apply to leads.
- Load. A heat map: how many deals and leads are created by day of week and hour. The All / Deals / Leads switch.
- Losses. Deals moved to Rejected in the selected period, by reason (resolution): how many and for what sum (sums per currency separately). Old rejections have no resolution and are in the No resolution row.
- Top clients. The ten clients with the largest sum of successful deals for the period in the chosen currency (there are no exchange rates, so currencies are not mixed).
Other employees see the dashboard without the reports block, with the pie chart, as before.
Deals by status
The pie chart shows how deals are spread across stages: New, In progress, Negotiation, Pause, Success, Rejected. Each slice shows the number of deals and its share in percent. Below the chart are the same stages with counts. Stages that currently have no deals aren't shown.
If a big slice is Pause or Negotiation, deals are stuck: open the funnel and see where a next step is needed.
Recent activity
A feed of all deal actions in the organization, newest first:
- quick actions from the Action button on a deal card — Call connected, Call missed and others;
- deal status changes — with the old and new stage;
- other deal changes.
Each entry shows the deal name, who did it and when. The deal name opens its card. At the bottom of the feed there's a Load more button for older entries.
Settings: organization mail
The organization head sees a Settings section at the bottom of the dashboard (the Settings button at the top jumps to it). Shared organization mailboxes are connected there: Connect mailbox → address and password → Check → Save. These addresses can be picked in mailings and scenario steps. More in Mailboxes.